What Claude Dashboards needs from your data stack
On October 8 Anthropic moved Claude Dashboards into beta. You connect Claude to Snowflake, BigQuery, Databricks or your CRM, ask a question in plain English, and get back a dashboard that refreshes as the data changes. Click any number and you see the query behind it. When you want to go further, you push the dashboard into Hex, Sigma or Omni and continue there. We have been setting it up internally and for Vecten Core clients since the beta opened. It works about as well as the data platform it is pointed at. On a clean foundation it is a useful new way of working with company data. On a typical firm's data estate it produces a convincing wrong answer faster than anything we have seen.
Disclosure: Vecten is a Snowflake partner and we use Claude across our own operations. Nobody is paying for this post.
Where these dashboards fit
BI has always had a last-mile problem. A partner who wanted this quarter's deal flow by source compared to last quarter's had to find someone to build the view, and that person had a queue. Claude Dashboards removes the queue for that kind of question. The person asking builds the view in the time it takes to type it.
That is a real change, and it is worth being precise about what kind of change. After a few days with it, our take is that these dashboards are for ad hoc work and exploration: the mid-diligence question, the thing the CFO wants to check before a board call, the hypothesis an operating partner wants to test on Tuesday and forget by Thursday. They are not, yet, a replacement for the stable KPI dashboards a firm shares across teams and reconciles every month. Those have a different job. They are the agreed version of the numbers, they change slowly on purpose, and someone is accountable for them. Claude Dashboards sits next to that layer, not instead of it, and the two work best when they draw from the same source.
Claude does not fix your data
Claude Dashboards is a query and presentation layer. It does not reconcile your CRM against your data provider. It does not know that the revenue column in one table means bookings and in another means recognized revenue. It does not know that two of the three records for a company are leftover duplicates from a 2023 migration. It writes a correct query against whatever schema it finds, builds a clean chart, shows you the SQL, and hands over the result.
We wrote about this a few months ago in the context of analyst agents: pointed at raw schemas, they produce answers that are syntactically perfect and semantically wrong. A dashboard makes this worse than a chat answer does, because a chart carries more authority than a sentence. A number with a timestamp and a "view query" button looks like infrastructure. People forward it. It ends up in an IC memo.
Self-service BI has always carried this risk. What changed is the cost of a mistake. When building a dashboard required an analyst, the analyst was the quality check. Now anyone in the firm can build one in thirty seconds, and there is no one between the data and the partner meeting.
What "ready" means
The requirements are the same ones a data platform has always needed. The difference is that the return on meeting them is now visible to every non-technical person in the firm.
Claude connects to a warehouse, not to a dozen SaaS tools, so the data has to be in one governed place. Each metric needs one definition, held in a semantic layer, so that Claude and your finance team compute the same thing when they both say "ARR" or "active deal" or "patient encounter". Records need to be deduplicated and validated, with freshness checks that run on a schedule rather than when someone notices. You need lineage, because Claude will show the query and you will need to show where the data in the query came from when the dashboard lands in front of an LP or an auditor. You need access control, because Claude queries with the permissions of the person asking, which only helps if your warehouse has a permissions model to inherit. And you need MCP, the protocol Claude uses to reach the platform. Without it there is nothing to connect.
Miss one of these and the dashboard is wrong in a way nobody can see.
Why this works out of the box on Vecten Core
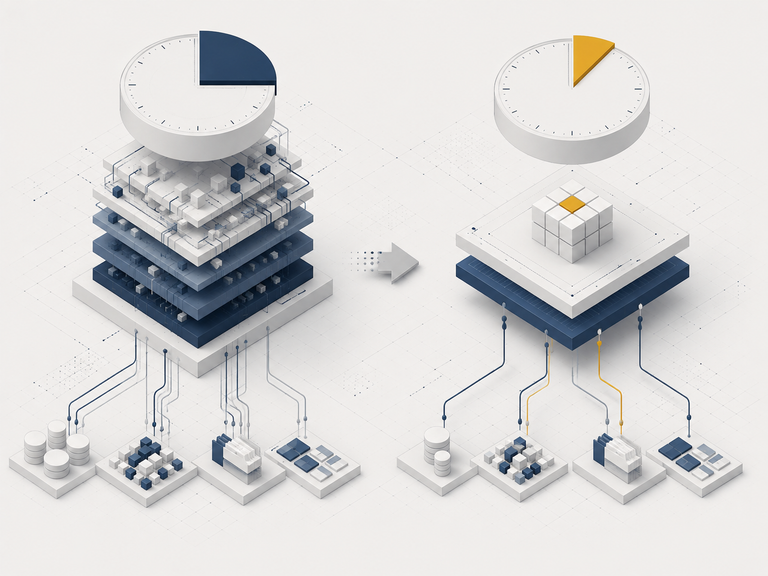
We built Vecten Core on the assumption that the tools on top would keep changing and the foundation would not. Core runs on Snowflake in the client's own cloud account. Every source flows in through automated ingestion, cleaning and transformation into one modeled layer, with lineage and role-based access from the start. MCP with a semantic layer is part of the standard deployment. Connecting Claude Dashboards to a Core client takes minutes because the endpoint already exists, the definitions are locked, and the permissions already apply. A partner asking for pipeline by stage gets the same figures as the quarterly deck, because both come from the same tables.
The platform is the smaller part of what we bring, though. The larger part is having done this across a number of firms and having heard what each of them actually needed. A VC fund wants Claude reaching across CRM, data provider and portfolio reporting at once, and cares most about entity resolution. A PE firm wants portco data walled off by deal team. A healthcare client cannot have PHI anywhere near an LLM without a clear answer on what the model sees, what it stores, and what the BAA covers. And any firm whose edge is a proprietary scoring model or a hand-built dataset needs to think about which parts of that get exposed through an MCP endpoint at all, and to whom. None of this is in the Anthropic documentation. It is the kind of thing you learn by implementing the tool at one client and getting the feedback at the next.
Doesn't Snowflake already do this?
For data that lives in Snowflake, Cortex Analyst on a well-built semantic model is a strong product. We build it and recommend it. Claude Dashboards does not replace it. It is another way into the same governed layer, one that many teams already have open all day. Which interface a team prefers is a deployment decision, and a reversible one. The semantic model and the clean, connected data underneath are what make either of them trustworthy.
If you are not there yet
The temptation is to start with the AI tool, because the AI tool is the exciting part. Connect it to whatever warehouse you have, see what happens, fix the foundation later. We would push back on that order. The dashboards will look good immediately, so the data problems get discovered by the people least equipped to recognize them, in the meetings where it matters most.
Better to find out what you have first. Vecten Compass is a fixed-fee workshop that maps every system, source, integration and gap, then produces a prioritized roadmap with effort estimates for getting to one governed platform. The roadmap is yours whether or not you build it with us. If it turns out your CRM and your fund admin system have never agreed on a company count, better to learn that from a workshop than from a dashboard in front of the IC.
Claude Dashboards is the best tool of this kind right now. Something else will be the best one next spring. The foundation is what makes either of them worth connecting to.
Vecten builds and operates AI-native data platforms for private capital and healthcare. Talk to us about where your data stands.
Recent posts